


A spectrometer separates polychromatic light by wavelength to reveal its spectral composition—core laser parameters such as centre wavelength, linewidth and side-mode suppression ratio are read with it. This article covers the principles, key parameters, main types and typical applications.
Table of Contents
- 1. What Is a Spectrometer? Understanding the Core Concepts
- 2. Working Principle: How Is a Spectrometer Implemented?
- 3. Key Parameters: Understanding the Performance Indicators of a Spectrometer
- 4. Main Types: What Kinds of Spectrometer Exist?
- 5. Applications: Where Are Spectrometers Used?
- 6. Common Misconceptions: Pitfalls to Avoid
1. Core Concepts: What Is a Spectrometer?
< A spectrometer (here mainly referring to an optical spectrum analyser, OSA) is a precision instrument that measures the distribution of optical power by wavelength/frequency. In simple terms, it tells you which wavelengths a beam of light contains and how much power each wavelength carries. A spectrometer is one of the most basic and most commonly used devices in laser diagnostics—whether measuring a laser’s centre wavelength, linewidth or side-mode suppression ratio, or analysing the spectral width of an ultrashort pulse, it is indispensable.
A spectrometer does not generate light; it separates existing light by wavelength to ‘read’ its composition—answering which wavelengths are present and how strong each is, and serving as the tool for measuring centre wavelength, linewidth and spectral purity.
2. Working Principle: How Is a Spectrometer Implemented?
Understanding the working principle of a spectrometer can actually be broken down into several key steps or mechanisms. Let us look at them one by one:
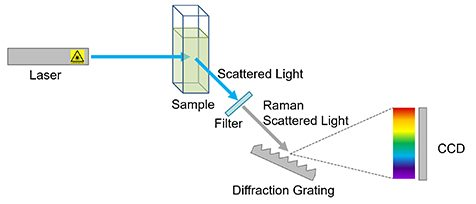
Different types of spectrometers work very differently, but the core idea is ‘split the light + measure the light.’ The most common grating spectrometer uses a diffraction grating to spatially separate different wavelengths (dispersion), then rotates the grating so that light of a specific wavelength passes through a slit to the detector, scanning out the complete spectrum point by point. Fourier-transform spectrometers are based on a Michelson interferometer, recording interference signals at different arm-length differences and then obtaining the spectrum through a Fourier transform. There are also high-resolution spectrometers based on a Fabry–Pérot interferometer, using the wavelength selectivity of resonance peaks to achieve extremely fine spectral resolution.
3. Key Parameters: Understanding the Performance Indicators of a Spectrometer
| Parameter Name | Meaning | Why It Matters |
|---|---|---|
| Wavelength Range | The wavelength interval the instrument can measure, such as 600–1700 nm | The most basic parameter of a spectrometer, determining the measurable wavelength interval; choose a suitable range according to the light source under test. |
| Wavelength Resolution (RBW) | The smallest resolvable wavelength difference; about 0.1–5 nm for ordinary grating types, below 10 pm for high-end models | The smallest resolvable wavelength difference, directly determining the ability to measure fine spectral structure; the most core performance indicator of a spectrometer. |
| Wavelength Accuracy | The deviation between the measured and true wavelength values, depending on calibration status | The accuracy of wavelength readings, affected by calibration precision and temperature drift, crucial for quantitative wavelength measurement. |
| Dynamic Range | The ratio of the strongest signal to the weakest measurable signal, in dB; double monochromators can exceed 70 dB | The ratio of the strongest to the weakest measurable signal, determining whether strong and weak signal components can be measured simultaneously. |
| Sensitivity | The minimum optical power that can be detected | The ability to detect weak optical signals, determining whether low-power sources and weak spectral components can be measured. |
| Scan Speed | The time required to complete one full-spectrum measurement | The time required to acquire a complete spectrum, important for applications needing fast monitoring or high-throughput measurement. |
These parameters are not isolated; they are interrelated and mutually constrained. For example, there is often a trade-off between a spectrometer’s spectral resolution and wavelength coverage—higher resolution usually means a narrower span covered in one shot, and vice versa. So to evaluate quality, you must consider the parameters together rather than one alone.
If you are not familiar with these parameters, that is fine—Soar Laser’s product pages have detailed parameter descriptions, and you can also consult our technical engineers directly to help you select.
4. Main Types: What Kinds of Spectrometer Exist?
Spectrometers can be classified in many ways, and different dimensions help us understand their characteristics from different angles. The following introduces the common classification methods one by one:
By Type
Grating-Scanning Spectrometers
The most classic and most commonly used type, based on diffraction-grating dispersion, with a wide wavelength range and good cost performance
Double-Monochromator Spectrometers
Two monochromators in series, with higher dynamic range (>70 dB), suitable for measuring weak sidebands
Fabry–Pérot Spectrometers
Extremely high resolution (GHz or even MHz level), but a small free spectral range, suitable for fine analysis of narrow-linewidth lasers
Fourier-Transform Spectrometers
Based on a Michelson interferometer, with high resolution and wide wavelength range, but limited dynamic range (30–40 dB)
Array Spectrometers
Use a CCD/InGaAs line-array camera to capture the whole spectrum at once, extremely fast but with lower resolution
Different types of spectrometers have their own advantages and disadvantages; there is no absolute ‘best,’ only ‘most suitable.’ Selection should consider your specific application scenario, power requirements, budget and other factors. For example, for industrial applications with high power requirements, fibre lasers may be more suitable; for research applications with ultrashort-pulse needs, Ti:sapphire may be more suitable.
5. Applications: Where Are Spectrometers Used?
Spectrometers have a very wide range of applications, from industrial manufacturing to healthcare, from communication networks to scientific research—almost everywhere lasers are used, spectrometers are indispensable. Let us look at a few fields briefly:
- Laser wavelength testing: measuring core parameters such as centre wavelength, linewidth and side-mode suppression ratio
- Optical communication system testing: channel power and signal-to-noise ratio testing in WDM systems
- Ultrashort-pulse characterisation: measuring pulse spectral width, combined with an autocorrelator to evaluate the time-bandwidth product
- Optical component testing: measuring the transmission/reflection spectra of filters, fibre gratings and so on
- Raman spectroscopy / fluorescence spectroscopy: analysing the wavelength distribution of scattered or fluorescent light
- Gas detection: detecting gas composition and concentration through absorption spectra
Typical Application Scenarios in Detail
Scenario 1: Laser Wavelength Testing
measuring core parameters such as centre wavelength, linewidth and side-mode suppression ratio For wavelength testing, choose the appropriate spectral resolution and calibration to read centre wavelength, linewidth and side-mode suppression ratio reliably.
Scenario 2: Optical Communication System Testing
channel power and signal-to-noise ratio testing in WDM systems WDM testing requires sufficient wavelength accuracy and dynamic range to resolve channel power and signal-to-noise ratio and to monitor crosstalk between channels.
Scenario 3: Ultrashort-Pulse Characterisation
measuring pulse spectral width, combined with an autocorrelator to evaluate the time-bandwidth product Ultrashort-pulse characterisation pairs with an autocorrelator; a wide enough spectral span estimates the time-bandwidth product, so balance resolution against one-shot coverage.
Scenario 4: Optical Component Testing
measuring the transmission/reflection spectra of filters, fibre gratings and so on When measuring the transmission/reflection spectra of filters and fibre gratings, watch stray-light level and wavelength accuracy so instrument error is not mistaken for device behaviour.
Scenario 5: Raman Spectroscopy / Fluorescence Spectroscopy
analysing the wavelength distribution of scattered or fluorescent light Raman and fluorescence signals are weak, so use a high-sensitivity, low-noise spectrometer and set a suitable integration time to improve signal-to-noise ratio.
👉 Want to learn more about practical application cases of spectrometers? Please visit Soar Laser’s application-case page, or contact our technical team directly for professional advice.
6. Common Misconceptions
Many people have somewhat plausible but mistaken notions about spectrometers. See whether you fall into any of the following misconceptions:
Misconception 1: ‘The power a spectrometer measures agrees with a power meter.’
a spectrometer measures the power within the resolution bandwidth, not total power; total power requires integrating the whole spectrum and is usually less accurate than a dedicated power meter
Misconception 2: ‘The higher the resolution, the better.’
higher resolution means slower scanning and possibly lower sensitivity; choose according to actual needs
Misconception 3: ‘A spectrometer can measure pulsed lasers.’
a scanning spectrometer assumes the input light is constant during the scan, which may be completely unsuitable for low-repetition-rate pulsed lasers
Misconception 4: ‘Dynamic range means the range from maximum to minimum measurable power.’
dynamic range emphasises more the ability to detect weak signals near strong ones, greatly affected by stray light, and is a different thing from absolute sensitivity
Misconception 5: ‘The wavelength a spectrometer reads out is absolutely accurate.’
wavelength readings depend on calibration; verify regularly against known spectral lines or systematic deviations appear
Of course, there are far more misconceptions about spectrometers than these. Laser technology is developing rapidly, with new materials and new processes constantly emerging, so some previous ‘common knowledge’ may already be outdated. If you have other questions, please leave a comment and we will answer them one by one.
Leave a Reply