


I. Overview
Overview of laser wavelength measurement techniques is an important concept and technology in the laser field. This article systematically introduces the relevant knowledge from the perspectives of principles, parameters, types and applications.
A laser’s wavelength is its “colour” — one of the most basic and most important parameters of a laser. When you buy a laser, the first thing you may ask is its wavelength; when you do an experiment, whether the wavelength is right directly determines whether the experiment succeeds. But have you ever wondered: how is a laser’s wavelength measured? Why can some wavemeters be accurate to several decimal places?
Measuring wavelength is simple if you only want an approximation — scan it with a spectrometer. But to be precise, it is a whole field of study. From the basic grating spectrometer to the astonishingly accurate Fabry–Pérot interferometer, from commercial wavemeters to research-grade heterodyne interferometric systems, different technical routes differ in accuracy by several orders of magnitude.
An interesting comparison: an ordinary grating spectrometer measures wavelength to about 0.1 nm (that is, 100 pm); a good wavemeter reaches 0.1 pm (10⁻¹³ m); and an optical frequency comb (frequency comb) reaches the 10⁻¹⁵ level — equivalent to measuring the Earth-to-Moon distance to within less than a millimetre.
The main application scenarios of wavelength measurement:
– Factory wavelength calibration of lasers
– Spectral analysis and material identification
– Channel detection in optical communication bands
– Wavelength calibration for LiDAR / rangefinding
– Precision metrology and scientific research
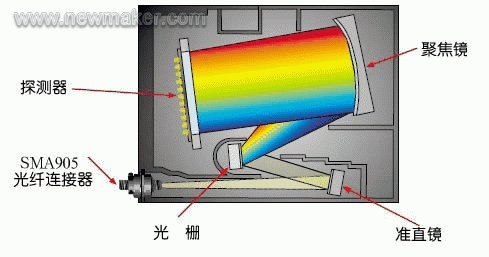
Optical-path schematic of the internal structure of a grating spectrometer
II. Core Principles: Six Major Wavelength Measurement Techniques
1. Grating Spectrometer Method
This is the most classic and most commonly used wavelength measurement method.
Basic principle: It uses the diffraction effect of a grating — light of different wavelengths diffracts at different angles and is thus separated in space. Detecting the light intensity at different positions with a CCD or photodiode array yields the spectrum.
Core formula (grating equation):
d × (sin α + sin β) = m × λ
where d is the grating constant, α the angle of incidence, β the diffraction angle, m the diffraction order and λ the wavelength.
Accuracy level:
– Ordinary grating spectrometer: 0.1–1 nm
– High-resolution grating spectrometer: 0.001–0.01 nm (1–10 pm)
– Depends on grating line density, focal length and slit width
Advantages:
– One measurement yields a broad spectral range
– Relatively simple structure, moderate cost
– Mature technology, easy to use
Disadvantages:
– Resolution and spectral range conflict (higher resolution means narrower range)
– Grating order-overlap problem (needs filters)
– Sensitivity limited by the entrance slit
2. Fabry–Pérot Interferometer Method (F-P Interferometer)
The Fabry–Pérot interferometer is a high-resolution instrument based on multi-beam interference.
Basic principle: Two parallel high-reflectance mirrors form an F-P cavity. Light reflects back and forth between the mirrors, forming multiple coherent beams. Only wavelengths satisfying the resonance condition (optical path difference equal to an integer multiple of the wavelength) are transmitted:
2 × n × L × cos θ = m × λ
where n is the refractive index of the medium inside the cavity, L the cavity length, θ the angle of incidence and m the interference order.
A scanning F-P interferometer scans the transmitted wavelength by changing the cavity length (driven by a piezo ceramic) or the gas pressure, obtaining the spectrum.
Accuracy level:
– Typical resolving power: 10⁶ to 10⁸ (finesse F = π√R/(1-R))
– Absolute measurement accuracy: about the 1–10 pm level
– Limited free spectral range (FSR), usually only a few to tens of nm
Advantages:
– Extremely high resolution, can distinguish very close wavelengths
– Relatively compact structure
– Suitable for fine spectral analysis
Disadvantages:
– Limited free spectral range; cannot determine absolute wavelength alone (must be combined with other methods)
– Extremely demanding mirror flatness
– Difficult alignment and adjustment
3. Michelson Interferometer Method (Fourier Transform Spectroscopy)
This is the core principle of Fourier-transform infrared spectrometers (FTIR) and can also be used for high-precision wavelength measurement.
Basic principle: A Michelson interferometer splits the incident light into two beams, which recombine and interfere after travelling different optical paths. By moving one mirror to change the optical path difference, an interferogram (intensity versus path difference) is recorded. A Fourier transform of the interferogram then yields the spectrum.
Resolution:
– Resolution ≈ 1 / L_max, where L_max is the maximum optical path difference
– For example, a path difference of 10 cm → resolution about 0.1 cm⁻¹ (about 0.01 nm at 1064 nm)
Advantages:
– High throughput (no slit needed), high signal-to-noise ratio
– Measures all wavelengths simultaneously (multiplex advantage)
– High and adjustable resolution
Disadvantages:
– Requires a precise moving-mirror scan mechanism
– Relatively slow (needs scanning)
– More common in infrared; fewer visible/near-IR applications
4. Wavemeter
A wavemeter is a commercialized high-precision wavelength-measurement instrument, usually based on F-P interference or Fizeau interference principles, with a built-in wavelength reference and automatic calibration.
Working principle (Fizeau-type wavemeter as an example):
– Incident light enters a wedge-shaped interference cavity (Fizeau interferometer)
– Different wavelengths form interference fringes with different spacings
– A CCD captures the fringes and the wavelength is calculated from the fringe spacing
– A built-in reference source (such as a He-Ne laser) provides real-time calibration
Accuracy level:
– Entry-level wavemeter: ±0.001 nm (1 pm)
– Mid-range wavemeter: ±0.1 pm
– High-precision wavemeter: ±0.001 pm (1 fm), accuracy reaching the 10⁻⁸ level
Advantages:
– Easy to use, one-button measurement
– High accuracy with built-in calibration
– Fast response (milliseconds to seconds)
Disadvantages:
– Relatively expensive (tens of thousands to hundreds of thousands)
– Limited applicable wavelength range
– High-end models need a constant-temperature environment
5. Heterodyne Interferometry (Beat-Frequency Method)
This is one of the most accurate wavelength measurement methods currently available, commonly used in research and metrology.
Basic principle: Combine the laser under test with a reference laser of known wavelength (known frequency) on a photodetector. Because the two frequencies are close, a beat frequency (difference frequency) is produced.
Beat-frequency formula:
f_beat = |f_1 - f_2|
If the reference frequency f₁ is very accurate (for example a frequency comb locked to an atomic clock), measuring the beat frequency f_beat gives the frequency of the light under test precisely (and hence its wavelength).
Accuracy level:
– Depends on the accuracy of the reference source
– With an optical frequency comb as reference: accuracy can reach 10⁻¹¹ to 10⁻¹⁵
– With a frequency-stabilized laser as reference: accuracy 10⁻⁸ to 10⁻¹⁰
Advantages:
– Extremely high accuracy, the “gold standard” of wavelength measurement
– Can measure absolute frequency / wavelength
Disadvantages:
– Requires a high-quality reference source
– Complex system, difficult to set up
– Only measures single-frequency continuous-wave light
6. Optical Frequency Comb (Frequency Comb)
The optical frequency comb was the achievement of the 2005 Nobel Prize in Physics; it completely transformed precision wavelength measurement.
Basic principle: The pulse train produced by a mode-locked laser appears in the frequency domain as a series of equally spaced spectral lines, like a “comb.” The comb-tooth frequencies can be locked to a radio-frequency reference (such as an atomic clock), so every tooth has a precisely known frequency.
Beating the laser under test against the comb tells you which tooth it corresponds to and by how much it is offset, yielding an extremely precise wavelength value.
Accuracy level:
– Relative accuracy: 10⁻¹¹ to 10⁻¹⁵ (depending on the reference clock)
– Equivalent to an uncertainty as small as 10⁻⁶ to 10⁻⁹ nm at a 1 μm wavelength
Advantages:
– The most accurate wavelength measurement method available
– Can measure any wavelength
– Can calibrate many wavelengths at once
Disadvantages:
– Extremely expensive equipment (hundreds of thousands to millions)
– Complex operation and maintenance
– Bulky, not suitable for portable use
III. Accuracy Comparison and Applicable Scenarios
| Measurement method | Typical accuracy | Wavelength range | Measurement speed | Price level | Applicable scenarios |
|---|---|---|---|---|---|
| Grating spectrometer | 0.1~1 nm | Broad (hundreds of nm) | Fast | Low → medium | routine spectral analysis, rough wavelength measurement |
| High-resolution grating spectrometer | 1~10 pm | Medium | Medium | Medium | high-resolution spectroscopy research |
| F-P interferometer | 1~10 pm | Narrow (within FSR) | Medium | Medium → high | fine spectral analysis, mode analysis |
| Commercial wavemeter | 0.001~1 pm | Fairly broad | Fast | Medium → high | laser wavelength calibration, production-line testing |
| Heterodyne interferometry | 10⁻⁴~10⁻² pm | Narrow (within beat-frequency range) | Fast | High | precision measurement in research |
| Optical frequency comb | 10⁻⁶~10⁻³ pm | Broad | Fast | Extremely high | metrology standards, cutting-edge research |
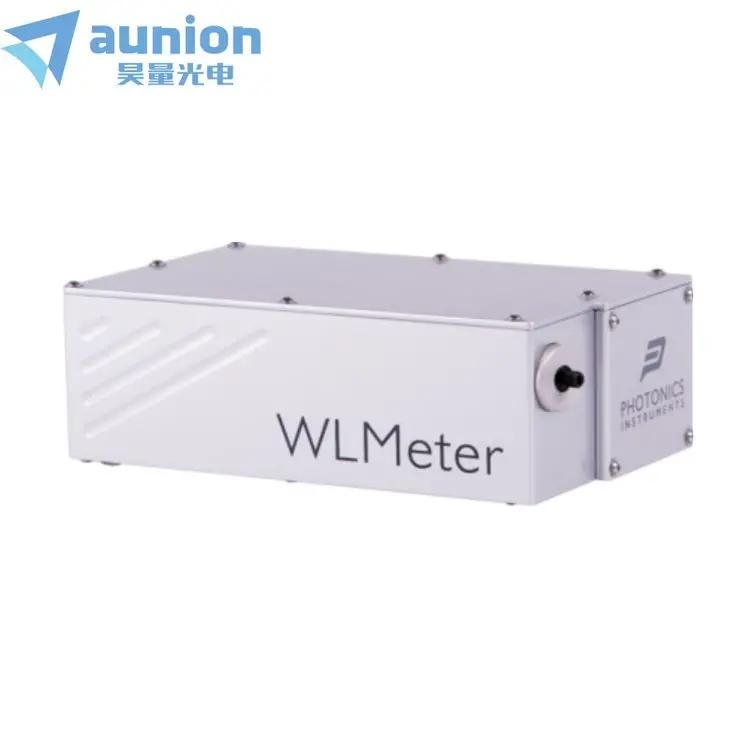
High-precision laser wavemeter product photo
IV. Common Misconceptions
Misconception 1: The higher the measurement accuracy, the better
Higher accuracy is of course good, but the price of high-precision instruments grows exponentially — improve accuracy tenfold and the price may rise a hundredfold. Select according to actual needs:
– Just confirming a laser’s wavelength → an ordinary spectrometer is enough
– DWDM channel testing in fibre communication → a wavemeter (±1 pm level)
– Atomic-physics precision spectroscopy → possibly frequency-comb-level accuracy
Buying a frequency comb to measure an ordinary diode laser’s wavelength is like using a micrometre to measure a brick — overkill.
Misconception 2: A wavemeter’s accuracy equals its display resolution
Many wavemeters display a high resolution (for example down to 0.0001 nm), but that does not mean their accuracy is at that level. Resolution ≠ accuracy. Actual accuracy is affected by calibration precision, temperature stability, nonlinearity and other factors, and is usually more than an order of magnitude lower than the display resolution.
For example, a wavemeter may display to 0.0001 nm but have an absolute accuracy of only ±0.001 nm — the last digit is effectively “fake.” When reading specifications, always distinguish “resolution” from “accuracy / uncertainty.”
Misconception 3: An F-P interferometer gives absolute wavelength directly
The transmission peaks of an F-P interferometer satisfy 2L = mλ — where m is an integer (the interference order). The problem is: seeing a peak, how do you know what m is? Without knowing m, you can only compute a relative wavelength, not an absolute value.
Therefore an F-P interferometer usually needs a known-wavelength reference (such as a He-Ne laser) to determine the order m before it can measure absolute wavelength. An F-P interferometer alone can only measure relative wavelength changes, not absolute values.
Misconception 4: Wavelength is wavelength; the measurement result is the same however you measure it
No. Wavelength measurement results are affected by many environmental factors:
– Temperature: the refractive index of air changes with temperature (about 1×10⁻⁶/°C), so wavelengths measured in air are temperature-dependent
– Air pressure: the refractive index of air also depends on pressure
– Humidity: smaller effect, but must be considered in high-precision measurement
– Angle of incidence: if light is not normally incident, the measured wavelength will be biased
Therefore high-precision wavelength measurement is done either in vacuum or by measuring temperature, pressure and humidity in real time and applying a refractive-index correction (Edlén formula).
V. Selection Advice
1. Select by Accuracy Requirement
- ±0.1 nm level: ordinary grating spectrometer, for general wavelength confirmation
- ±0.01 nm level: mid-to-high-end spectrometer or entry-level F-P, for spectral analysis
- ±1 pm level: mid-range wavemeter, for laser production testing
- ±0.1 pm level: high-precision wavemeter, for research and precision measurement
- Even higher accuracy: heterodyne method or frequency comb, for metrology and cutting-edge research
2. Select by Use Scenario
- Laboratory research: consider a combination of a versatile spectrometer + high-precision wavemeter
- Production-line QC: prioritise wavemeters that are fast, simple to operate and stable
- Field / on-site: choose portable, environmentally rugged models (mind the temperature range)
- Fibre-optic communication testing: choose a wavemeter optimised for the C/L bands
3. Precautions
- Confirm the instrument’s wavelength range covers your application band
- Check the input interface — free-space or fibre-coupled?
- Single-frequency or multimode laser? Is that measurement mode supported?
- Is continuous monitoring needed? What are the data logging and export features?
- Calibration cycle and method — how often does it need calibration?
VI. Application Scenarios
1. Laser Production and QC
- Factory wavelength calibration of lasers
- Wavelength stability testing
- Modal spectral analysis (single-longitudinal-mode / multimode detection)
- Temperature-tuned wavelength characterisation
2. Fibre-Optic Communication
- Wavelength channel detection in DWDM systems
- Laser wavelength locking and calibration
- Fibre Bragg grating (FBG) wavelength measurement
- Wavelength planning and monitoring of WDM networks
3. Spectral Analysis
- Raman and fluorescence spectroscopy
- Atomic / molecular absorption spectroscopy
- Material property characterisation
- Environmental monitoring gas analysis
4. Precision Metrology and Research
- Precision length measurement (laser interferometer)
- Atomic clocks and frequency standards
- Quantum optics experiments
- Cutting-edge physics research such as gravitational-wave detection
5. LiDAR and Sensing
- LiDAR wavelength calibration
- Fibre sensor wavelength demodulation
- Wavelength detection in distributed sensing systems
VII. Recommended Reading
- What Is an Optical Spectrum Analyser? How to Analyse a Laser’s Colour Components
- What Is a Wavemeter? How to Measure Laser Wavelength Precisely
- What Is a Spectrometer? How to Split Light into a Rainbow
- What Is a Photodetector? How Light Signals Become Electrical Signals
- What Is an Optical Power Meter? How to Measure Laser Power Accurately
References: Principles of Lasers, Optical Spectroscopy Techniques, RP Photonics Encyclopedia – Optical Spectrum Analysis, Fourier-Transform Infrared Spectroscopy Techniques
Leave a Reply