


1. Core concept: what is an optical spectrum analyser?
An optical spectrum analyser (OSA) spreads a light signal out by wavelength and gives the power distribution point by point. It is the core tool for judging whether a laser is single mode, whether parasitic side modes have appeared, and how good the signal quality of an optical communication channel is.
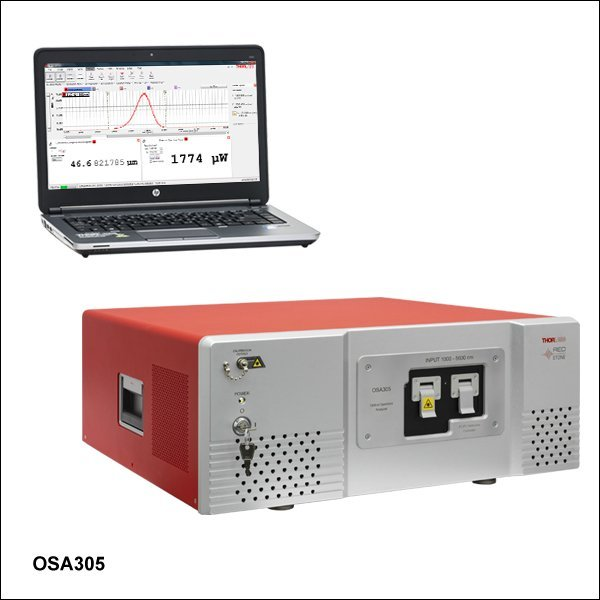
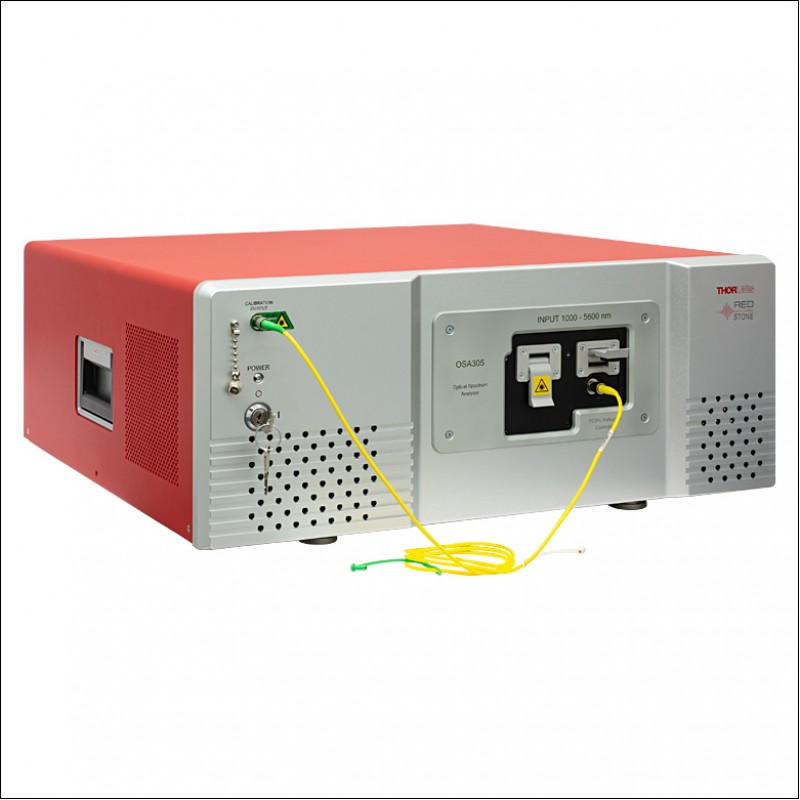
An optical spectrum analyser (Optical Spectrum Analyser, OSA, called an “OSA” below) is a precision instrument for measuring the spectral distribution of a light signal, that is, how the optical power varies with wavelength (or frequency). It tells you which wavelength components are present in a beam, how strong each of them is, how wide the spectral line is, and whether there are sidebands or stray components…
If the optical power meter measures “how much energy there is in total”, the spectrum analyser measures “how that energy is distributed across the different colours”. In laser R&D, optical communication testing and spectroscopic research, the OSA is an indispensable high-end analysis instrument — it is the equivalent of a radio-frequency spectrum analyser in optics, and it reveals the finest spectral features of a light signal.
Accurate spectral measurement is needed because many key performance figures of a laser — the linewidth, the side mode suppression ratio, the signal-to-noise ratio — are determined by spectral analysis. The spectral curve of a laser conceals its mode purity, its stability and its quality level. Understanding the principle, the parameters and the selection method of spectrum analysers is the first step toward using laser spectral analysis well.
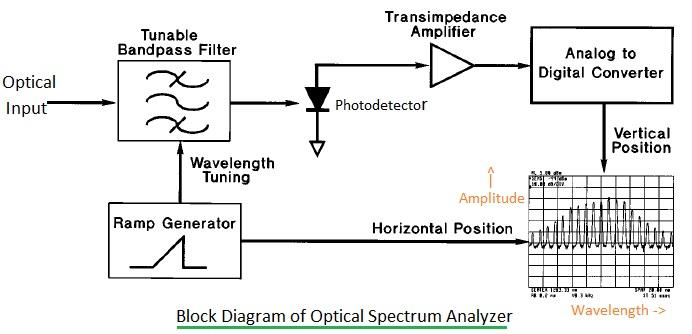
2. Working principle: how does an OSA work?
There are several technical routes for a spectrum analyser, each with its own advantages and drawbacks:
Grating-based optical spectrum analysers (Grating-based OSA)
This is the classic and most widely used type of OSA, based on the dispersing principle of the diffraction grating:
1. Grating dispersion: the input light passes through a slit onto the diffraction grating, and because the diffraction angle differs with wavelength, the different colours are separated in space (dispersion).
2. Wavelength scanning: by rotating the grating, successive wavelengths pass through the exit slit and fall on the photodetector behind it. Measuring the intensity while the grating turns gives the intensity as a function of wavelength — the spectrum.
3. Signal processing and display: the detector signal is amplified and processed, then displayed as a spectrum with wavelength on the horizontal axis and optical power (usually on a logarithmic dBm scale) on the vertical axis.
The core of a grating OSA is the monochromator structure. To raise the dynamic range (suppressing stray light), high-end models use a double monochromator arrangement (two monochromators in series), which reaches a dynamic range above 70 dB.
The wavelength resolution of a grating OSA is set by the dispersion of the grating and the slit width; typical values run from 0.1 nm to 5 nm, and high-end models reach 10 pm (0.01 nm) or better.
Fabry-Pérot interferometer spectrum analysers (Fabry-Pérot OSA)
Based on the wavelength selectivity of a Fabry-Pérot (F-P) interferometer:
1. F-P cavity wavelength selection: a Fabry-Pérot interferometer has high transmittance only at its resonant wavelengths, and the transmission peaks are extremely sharp.
2. Wavelength tuning: a piezoelectric ceramic fine-tunes the length of the F-P cavity so that the resonant wavelength scans, which produces the wavelength sweep.
3. Extremely high resolution: the resolution of an F-P OSA can be very high (the MHz level, corresponding to picometer and even sub-picometer wavelengths), far beyond the grating type.
There is, however, a fundamental limitation to the F-P type — the free spectral range (FSR) is small, so only a very narrow wavelength range can be measured at a time and it cannot serve as a general-purpose wideband analyser. It is used mainly in special applications that need very high resolution over a narrow range, such as measuring laser linewidth or monitoring the spectrum of an optical communication signal.
Fourier transform spectrum analysers (Fourier Transform OSA)
Based on the principle of the Michelson interferometer:
1. Interferogram acquisition: one mirror of the interferometer is moved and the interferogram (the autocorrelation function) of intensity against optical path difference is recorded.
2. Fourier transform: a fast Fourier transform (FFT) of the interferogram gives the intensity as a function of optical frequency — the spectrum.
3. Wide spectrum and high resolution in one sweep: a Fourier transform spectrometer can cover a wide wavelength range in a single sweep while achieving high resolution. The resolution is set by the maximum optical path difference scanned.
The advantage of a Fourier transform OSA is the combination of a wide spectral range with high resolution and uniform sensitivity at long and short wavelengths. Its weakness is the limited dynamic range (about 30–40 dB), because the noise floor of a strong signal masks weaker ones — in this respect it is inferior to the grating type.
3. Key parameters: reading the specifications of a spectrum analyser
Knowing the concept and the principle is not enough to evaluate a spectrum analyser; you also need to understand its key parameters. The table below sorts out the core parameters.
| Parameter | Meaning | Why it matters |
|---|---|---|
| Wavelength range | The range of wavelengths the instrument can measure. Common communication-band OSAs cover 1200–1700 nm, and general-purpose models may cover more widely (for example 600–1700 nm). Some models can be extended by changing the grating or the detector. | It decides which bands can be measured and is set by the grating parameters and the detector type. It must cover the whole wavelength range of the source under test, or the complete spectrum cannot be captured. |
| Resolution bandwidth (Resolution Bandwidth, RBW) | The smallest wavelength interval that can be resolved, i.e. the spacing between the two closest resolvable spectral lines. The higher the resolution, the finer the spectral structure that can be seen. Typical grating values run from 0.1 nm to 5 nm (10 pm for high-end models), F-P types reach MHz and even kHz, and Fourier transform types are around 0.03 nm. | One of the most central parameters of a spectrum analyser; it decides whether fine spectral structure such as side modes or narrow linewidths can be seen. The smaller the RBW, the higher the resolution, but the sweep takes longer and the noise level rises (because less optical power falls into each resolution bin). A trade-off between resolution and sensitivity is needed. |
| Wavelength accuracy | The deviation between the measured wavelength and the true value, which depends on the calibration accuracy of the instrument. Note that this is a different concept from resolution. | The accuracy of the wavelength reading depends on the quality of the wavelength calibration. High-accuracy wavelength measurement requires periodic calibration, usually with a reference source of known wavelength. |
| Dynamic range | The ratio between the strongest and the weakest signal that can be measured at the same time, usually expressed in dB. A grating OSA with a double monochromator reaches above 70 dB, while a Fourier transform type is around 30–40 dB. | It decides how weak a signal can still be detected and how large the contrast between strong and weak signals can be. With a low dynamic range, weak peaks are drowned in the noise and weak peaks next to a strong peak become invisible. |
| Sensitivity / noise floor | The smallest optical signal power that can be detected, usually expressed in dBm. The higher the sensitivity, the weaker the spectral components that can be detected. | It sets the minimum signal level that can be detected. Higher sensitivity suits the spectral analysis of weak signals, such as those from low-power lasers. |
| Power measurement accuracy | How accurately the optical power is measured. The power accuracy of an OSA is usually worse than that of a dedicated power meter, because coupling efficiency and resolution bandwidth have a large influence. | It is the accuracy of the power readings of the individual spectral components, and it determines how much the measurements of key parameters such as OSNR can be trusted. |
| Sweep speed | The time needed to complete one full spectral sweep. The sweep speed is tied to the resolution setting — the higher the resolution, the slower the sweep. | The time a full spectral sweep takes. Fast sweeps suit real-time monitoring, while slow sweeps give a higher signal-to-noise ratio and better resolution. |
| Polarisation dependence | The degree to which the measurement changes with the polarisation state of the input light. An ideal OSA should be polarisation independent, but grating types may show polarisation dependence that needs special design to remove. | It is the extent to which the result depends on the polarisation of the incident light. Strong polarisation dependence makes the readings inconsistent between polarisation states, so precision work calls for a low-polarisation-dependence OSA. |
On the resolution limit of an OSA: it is worth stating clearly that an ordinary grating OSA cannot measure a genuinely narrow-linewidth laser in the kHz–MHz range. Even the highest-resolution grating OSA only reaches about 10 pm (roughly 4 GHz at 1550 nm); the F-P type can reach the MHz level, but measuring an extremely narrow linewidth in the kHz range normally calls for the self-heterodyne method or a coherent receiver scheme rather than an OSA in the usual sense. This is a very important point when selecting: do not assume that a “high-resolution OSA” measures every narrow linewidth.
4. Main types: what kinds of spectrum analyser are there?
Spectrum analysers can be classified in many ways, and each dimension reveals different aspects of their behaviour. The common ones are introduced below:
By technical principle
#### Grating-scanning types
The most general-purpose OSA, with a large dynamic range and a wide wavelength range; the mainstay in laboratory and industrial testing.
#### Fourier transform types
Wide range plus high resolution, with the dynamic range as the weak point. In principle they share their origin with the scanning Michelson scheme of the wavemeter, but the spectrum analyser sweeps a much larger range and offers a more complete feature set.
#### Fabry-Pérot types
Extremely high resolution but a narrow measurement range (limited FSR), used where special high-resolution performance is needed.
#### Arrayed waveguide grating (AWG) types
Based on planar waveguides, with no moving parts and high speed, used mainly for monitoring optical communication channels.
By application field
#### Communication-dedicated types
Optimised for the 1310/1550 nm bands, used for DWDM system testing, often with fibre inputs and dedicated channel analysis.
#### General research types
A wide wavelength range and flexible features, suited to research laboratories.
#### Ultraviolet / visible types
Operating in the ultraviolet and visible bands, used for fluorescence and Raman spectroscopy.
#### Infrared-dedicated types
For the mid- and far-infrared bands, such as CO₂ laser spectra and gas analysis.
By form factor
#### Benchtop / rack types
The highest performance and the most complete feature set; the standard choice for laboratories and production lines.
#### Modular / USB types
More compact, connected to a computer over USB, flexible in use and relatively inexpensive.
#### Handheld types
Battery powered and portable, suited to field testing and maintenance.
Each type of spectrum analyser has its own advantages and drawbacks; there is no absolute “best,” only the “most suitable.” The choice should follow the specific application — the wavelength range, the resolution requirement, the dynamic range needed, the budget and other practical factors.
5. Applications: where are spectrum analysers used?
The spectrum analyser is one of the most important analysis instruments in optics, and its applications are extremely broad:
- Laser spectral characterisation: measuring the centre wavelength, the linewidth, the side mode suppression ratio (SMSR) and the spectral shape of a laser is central to evaluating its performance. The SMSR is the key measure of mode purity in a single-mode laser: the higher the value, the more the fundamental mode dominates and the weaker the side modes.
- Optical communication system testing: in DWDM systems, the wavelength, power and signal-to-noise ratio (OSNR) of each channel are checked to make sure every channel works and none crosstalks into another. It is an essential instrument for the development, manufacture and maintenance of optical communication.
- Optical passive component testing: the transmission and reflection spectra of fibre Bragg gratings (FBGs), wavelength division multiplexers (WDMs) and optical filters are measured to characterise their spectral behaviour.
- Laser linewidth measurement: high-resolution methods (the F-P type, the self-heterodyne method) are used to measure the spectral linewidth of a laser and assess its frequency stability.
- Raman and fluorescence spectroscopy: the Raman or fluorescence spectrum of a material is measured for analysis and materials research. Such applications usually demand high sensitivity and a large dynamic range.
- Gas detection and environmental monitoring: gas composition and concentration are determined by analysing absorption spectra, as in the spectral analysis step of TDLAS.
- Optical amplifier testing: the gain spectrum and noise figure of optical amplifiers such as EDFAs are measured.
- Ultrashort pulse spectral analysis: the spectrum of femtosecond and picosecond pulses is measured, and together with an autocorrelator it gives a complete characterisation of an ultrafast pulse. The shape of the gain spectrum directly affects the temporal characteristics of the pulse.
6. Common misconceptions
Many beliefs about spectrum analysers are plausible but wrong. Check whether any of the following misconceptions apply to you:
Misconception 1: the optical power an OSA reads is absolutely accurate
The power accuracy of an OSA is usually worse than that of a dedicated optical power meter. There are several reasons. First, the power an OSA displays is the power within the resolution bandwidth (RBW), so the reading changes with the RBW setting. Second, uncertainty in the coupling efficiency (particularly for free-space input) affects the power reading directly. Third, the detector and optical system of an OSA are optimised for dispersion, not for accurate power measurement. Use a power meter when the power itself has to be accurate; the OSA is better suited to looking at the shape of the spectrum and its relative distribution.
Misconception 2: the higher the resolution setting, the better
Higher resolution shows the spectral detail more clearly, but it has a price: longer sweep times (finer step sizes), less optical power at each wavelength point (lower sensitivity) and more noise. Higher resolution also means a more expensive instrument. In practice the resolution should be matched to the task — as long as the spectral features of interest can be seen. For instance, a low resolution is enough to capture the overall shape of a broadband source, and it is much faster; high resolution is needed only for fine features such as narrow linewidths or side mode suppression ratios.
Misconception 3: every spectrum analyser can measure the spectrum of a pulsed laser
Scanning OSAs (both grating-scanning and Fourier transform scanning) have a precondition for measurement: the optical spectrum should remain stable during the sweep. For a continuous-wave (CW) laser this is no problem. For a pulsed laser, especially at low repetition rates, the pulses may not appear in sync with the sweep, and the resulting spectrum is wrong or unstable. Mode-locked lasers at high repetition rate can usually be measured, since the average effect is close to that of continuous light. For low-repetition-rate Q-switched pulses, however, a scanning OSA may be entirely unsuitable and another method is needed (for example a spectrum analyser with synchronous triggering).
Misconception 4: a dynamic range of 70 dB means a signal 70 dB weaker than the main peak is visible
Dynamic range has to be read carefully. An OSA has two meanings for it: one is the total dynamic range, the ratio between the maximum measurable optical power and the noise floor; the other is the adjacent channel dynamic range (also called the stray light rejection ratio), the ratio of the weakest signal visible at a given wavelength offset from the main peak to the main peak itself. The latter is more useful in practice but also harder to achieve, because the stray light of the main peak creates a background nearby that masks weak signals. The double monochromator arrangement exists precisely to raise the adjacent channel dynamic range. Dynamic range is also tied to the resolution bandwidth setting — a smaller RBW lowers the noise floor but makes the effect of stray light more prominent. When reading a specification, find out under what conditions the dynamic range is defined.
7. Recommended reading
- What is a wavemeter? How laser wavelengths are measured precisely
- What is an optical power meter? How to measure laser power accurately
- What is a photodiode? The most basic light-detecting device
References:
- RP Photonics Encyclopedia – Optical Spectrum Analyzers
- Yokogawa – Optical Spectrum Analyzer Technical Guide
- Thorlabs – Optical Spectrum Analyzers Documentation
Leave a Reply