


FROG (Frequency-Resolved Optical Gating) measures both the intensity and the phase of an ultrashort pulse, fully reconstructing it—something a power meter or autocorrelator cannot do. This article covers the principles, key parameters, main types and typical applications.
Table of Contents
- 1. What Is FROG? Understanding the Core Concepts
- 2. Working Principle: How Is FROG Implemented?
- 3. Key Parameters: Understanding the Performance Indicators of FROG
- 4. Main Types: What Kinds of FROG Exist?
- 5. Applications: Where Is FROG Used?
- 6. Common Misconceptions: Pitfalls to Avoid
1. Core Concepts: What Is FROG?
< Frequency-Resolved Optical Gating (FROG) is a powerful technique for the ‘complete characterisation’ of ultrashort laser pulses. Unlike an autocorrelator, which measures only pulse width, FROG can measure both the amplitude and phase information of a pulse—that is, it can fully reconstruct the electric field of the pulse as it changes over time, including judging whether the pulse is chirped and what shape it has. It is currently one of the most mainstream complete-characterisation methods in the field of ultrafast laser pulse diagnostics.
FROG is a measurement technique rather than a light source—it overlaps a pulse with time-shifted copies of itself, records a sequence of spectra, and uses an iterative algorithm to recover the pulse’s intensity and phase, fully reconstructing an ultrashort pulse.
2. Working Principle: How Is FROG Implemented?
Understanding the working principle of FROG can actually be broken down into several key steps or mechanisms. Let us look at them one by one:
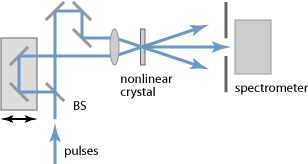
The setup of FROG is similar to an intensity autocorrelator—the pulse is split into two beams, one is delayed and then interacts with the other in a nonlinear crystal. The key difference is: instead of a simple photodetector, FROG uses a spectrometer to record the spectrum of the signal generated by the nonlinear interaction. By scanning different time delays and recording a series of spectra, a two-dimensional ‘FROG trace’ is obtained (horizontal axis wavelength, vertical axis time delay). This 2D image contains the amplitude and phase information of the pulse; through a dedicated iterative phase-retrieval algorithm, the complete pulse electric field (including temporal shape and spectral phase) can be reconstructed from the FROG trace.
3. Key Parameters: Understanding the Performance Indicators of FROG
| Parameter Name | Meaning | Why It Matters |
|---|---|---|
| Measurable Pulse-Width Range | From a few femtoseconds to tens of picoseconds, depending on the delay line and spectrometer parameters | The most core performance indicator of FROG, determining the range of pulse widths that can be completely measured. |
| Wavelength Range | Determined by nonlinear-crystal phase matching and the spectrometer’s detection range | Jointly determined by the working ranges of the nonlinear crystal and spectrometer, which must cover the full spectrum of the pulse under test. |
| Temporal Resolution | Depends on the minimum delay step | The smallest time feature that can be resolved, determined jointly by the delay-line step and the algorithm. |
| Spectral Resolution | Depends on the spectrometer’s grating and slit settings | The resolving power of spectral measurement, directly affecting the accuracy of phase retrieval and the narrowest measurable pulse width. |
| FROG Error (G Error) | The difference between the algorithm-reconstructed trace and the measured trace, characterising reconstruction quality | The mean-square error between the retrieved result and the original measurement data, an important indicator of result reliability, usually requiring <0.01. |
| Sensitivity | The lowest pulse energy that can be measured; SHG FROG has the highest sensitivity | The minimum pulse energy required to complete a measurement, determining the instrument’s applicable scenarios and sample requirements. |
These parameters are not isolated; they are interrelated and mutually constrained. For example, there is often a trade-off between a FROG’s temporal resolution and measurable pulse-width range—higher resolution usually limits the span covered in one measurement, and vice versa. So to evaluate quality, you must consider the parameters together rather than one alone.
If you are not familiar with these parameters, that is fine—Soar Laser’s product pages have detailed parameter descriptions, and you can also consult our technical engineers directly to help you select.
4. Main Types: What Kinds of FROG Exist?
FROG can be classified in many ways, and different dimensions help us understand its characteristics from different angles. The following introduces the common classification methods one by one:
By Type
Second-Harmonic FROG (SHG FROG)
The most commonly used type, based on the frequency-doubling effect of a χ(2) crystal; high sensitivity, but with a time-direction ambiguity (unable to tell whether the pulse is positively or negatively chirped)
Polarisation-Gate FROG (PG FROG)
Based on the χ(3) effect, gating via polarisation rotation; unambiguous but less sensitive
Transient-Grating FROG (TG FROG)
Uses three beams to form a transient grating, with higher sensitivity than SD FROG
Cross-Correlation FROG (XFROG)
Uses a known reference pulse interacting with the pulse under test; higher sensitivity, able to measure extremely weak pulses
GRENOUILLE
A simplified FROG structure with no moving parts and a compact design
Different types of FROG have their own advantages and disadvantages; there is no absolute ‘best,’ only ‘most suitable.’ Selection should consider your specific application scenario, power requirements, budget and other factors. For example, for industrial applications with high power requirements, fibre lasers may be more suitable; for research applications with ultrashort-pulse needs, Ti:sapphire may be more suitable.
5. Applications: Where Is FROG Used?
FROG has a very wide range of applications, from industrial manufacturing to healthcare, from communication networks to scientific research—almost everywhere lasers are used, FROG is indispensable. Let us look at a few fields briefly:
- Ultrafast laser R&D: complete characterisation of the amplitude and phase of femtosecond/picosecond pulses, guiding laser design
- Pulse shaping and compression: measuring pulse phase with FROG to precisely compensate dispersion and achieve transform-limited pulses
- Ultrafast spectroscopy research: experiments needing precise knowledge of the pulse shape, such as pump–probe spectroscopy
- Ultrafast amplifier systems: monitoring phase distortion of pulses during amplification
- Few-cycle pulse research: complete characterisation of pulses of only a few optical cycles requires FROG or similar techniques
Typical Application Scenarios in Detail
Scenario 1: Ultrafast Laser R&D
complete characterisation of the amplitude and phase of femtosecond/picosecond pulses, guiding laser design In femtosecond/picosecond laser R&D, FROG gives amplitude and phase together, guiding dispersion compensation and cavity design and shortening alignment cycles.
Scenario 2: Pulse Shaping and Compression
measuring pulse phase with FROG to precisely compensate dispersion and achieve transform-limited pulses In pulse shaping and compression, reading phase distortion with FROG and compensating dispersion precisely is how near-transform-limited pulses are obtained.
Scenario 3: Ultrafast Spectroscopy Research
experiments needing precise knowledge of the pulse shape, such as pump–probe spectroscopy Ultrafast experiments such as pump-probe need the exact pulse shape; the complete time-domain information from FROG cannot be replaced by an autocorrelator.
Scenario 4: Ultrafast Amplifier Systems
monitoring phase distortion of pulses during amplification Phase distorts during amplification; FROG monitors these changes and helps optimise the amplifier’s dispersion management and output quality.
Scenario 5: Few-Cycle Pulse Research
complete characterisation of pulses of only a few optical cycles requires FROG or similar techniques Few-cycle pulses require FROG or similar techniques for full characterisation, since phase information critically determines the pulse shape at this scale.
👉 Want to learn more about practical application cases of FROG? Please visit Soar Laser’s application-case page, or contact our technical team directly for professional advice.
6. Common Misconceptions
Many people have somewhat plausible but mistaken notions about FROG. See whether you fall into any of the following misconceptions:
Misconception 1: ‘FROG measurements are 100% accurate.’
FROG’s iterative algorithm depends on initial assumptions and measurement noise, so the reconstructed result has some uncertainty; judge it by the G error
Misconception 2: ‘SHG FROG functions the same as other FROGs.’
SHG FROG has a time-direction ambiguity (it cannot tell by itself whether the pulse is positively or negatively chirped), requiring auxiliary experiments to remove the ambiguity
Misconception 3: ‘FROG is just an advanced autocorrelator.’
FROG measures not only pulse width but also phase, giving far more information and a much more complex algorithm
Misconception 4: ‘All FROGs can measure all pulses.’
different FROG types have different applicable ranges; χ(3) types suit special bands such as ultraviolet, while χ(2) types are highly sensitive but limited by phase-matching bandwidth
Misconception 5: ‘FROG only measures pulse width.’
FROG’s key advantage is measuring intensity and phase together to fully reconstruct the pulse; pulse width is just one derived quantity
Of course, there are far more misconceptions about FROG than these. Laser technology is developing rapidly, with new materials and new processes constantly emerging, so some previous ‘common knowledge’ may already be outdated. If you have other questions, please leave a comment and we will answer them one by one.
Leave a Reply