


Laser Beam Quality Analysers
I. Overview
A laser beam quality analyser, quite simply, is a precision instrument purpose-built to “give a checkup” to a laser beam. It does more than check whether the intensity is sufficient — it tells you the true “quality” of a beam: how small the focus is, how large the divergence angle is, how pure the mode is, and what the M² factor is. For laser R&D, optical system alignment and factory inspection, a beam quality analyser is like the optometer in an optometrist’s hand — without it, you have no idea whether the laser in your hand has good “eyesight.”
You might ask: can’t a beam profiler and a power meter also measure a laser? What is the difference? A power meter only tells you “how much total energy there is,” a beam profiler tells you “what the cross-section looks like,” whereas a beam quality analyser performs a “dynamic scan” — moving step by step along the optical axis, measuring spot size at different positions, then using algorithms to calculate a whole set of parameters: M² factor, waist position, divergence angle and more. It could be called the “full-body CT scan” of beam diagnostics.
The mainstream beam quality analyser brands on the market today include Thorlabs, Ophir Spiricon, DataRay and Cinogy, with prices ranging from tens of thousands to hundreds of thousands and large differences in accuracy and features.
One fact worth making clear: the ISO 11146 standard (the standard for measuring the beam-quality M² factor) explicitly states that M² must be measured by “multi-point scanning along the optical axis” — a single spot image cannot yield M². Alternative approaches such as shearing interferometry and Hartmann wavefront sensing are fast and require no mechanical scanning, but strictly speaking are not ISO 11146 standard methods — to obtain a standard-compliant M² value, multi-point scanning measurement is required.
The core parameters a beam quality analyser can measure:
- M² factor (beam propagation factor)
- Waist diameter and waist position
- Far-field divergence angle
- Beam parameter product (BPP)
- Spot profile (intensity distribution)
- Ellipticity, pointing stability
- Wavefront aberration (advanced models)
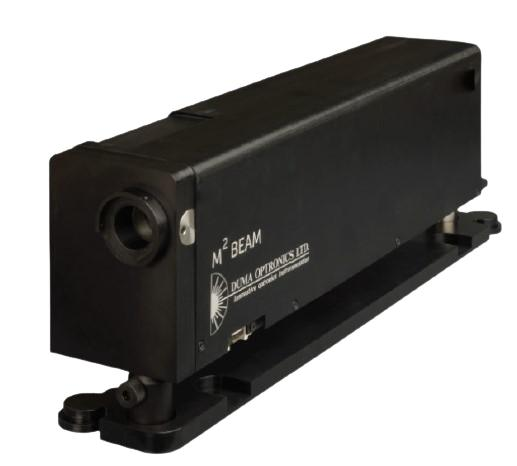
Schematic of the M² factor multi-plane sampling measurement principle
II. Working Principles
The core principle of a beam quality analyser is, in plain terms, “measure while moving” — move the detector or an optical element along the optical axis, measure spot size at different positions, then fit the complete beam parameters according to the propagation law.
There are several specific implementations, each with its own pros and cons. Three of the most mainstream technical routes are described below.
1. Shearing Interferometry
This is a method with no moving parts, relying on the principle of wavefront interference.
Basic idea: Split the incident beam into two, displace (shear) them slightly relative to each other, then produce interference fringes. By analysing the shape of the fringes, the wavefront of the incident light can be inferred, and the beam-quality parameters estimated.
Advantages:
- No mechanical moving parts, high reliability and fast measurement
- Wavefront information is obtained at the same time, strong aberration-analysis capability
- Relatively insensitive to vibration
Disadvantages:
- Complex algorithms requiring sophisticated phase retrieval
- Not friendly to high-power lasers (requires beam splitting)
- Limited measurement range; spots that are too large or too small are hard to measure
2. Scanning Slit / Pinhole Method
This is the most classic scheme and also the one most fully compliant with ISO 11146.
Basic idea: A precision translation stage moves a slit (or pinhole) along the optical axis, scanning the spot’s intensity distribution at different positions. A photodetector behind the slit receives the transmitted light intensity. One-dimensional scanning of the slit reconstructs the spot’s cross-sectional profile.
The complete procedure for measuring M² (ISO 11146 standard method):
- Locate the range: first do a rough scan to find the approximate waist position
- Near-field measurement: select at least 5 points around the waist and measure the spot diameter at each
- Far-field measurement: the measurement range should cover roughly ±2 Rayleigh lengths on either side of the waist — ISO 11146 requires at least half the measurement points to lie within one Rayleigh length on either side of the waist, and the other half at positions more than two Rayleigh lengths from the waist [(ISO 11146-1:2021)](https://www.iso.org/obp/ui/fr/#iso:std:iso:11146:-1:en)
- Data fitting: substitute all measurement points into the hyperbolic fitting formula
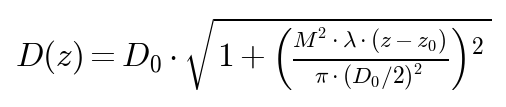
- Calculate results: extract the M² factor, waist diameter D₀, waist position z₀, divergence angle θ, etc. from the fitted parameters
Advantages:
- Most fully compliant with ISO 11146, highly authoritative data
- Large dynamic range, can measure spots from very small to very large
- Suitable for high-power lasers (only a small fraction of light passes the slit)
Disadvantages:
- Has mechanical motion, slow measurement (usually seconds to tens of seconds)
- Requires a precise translation stage, relatively costly
- Sensitive to vibration
3. Shack–Hartmann Wavefront Sensor Method
This is a method that has developed rapidly in recent years; it can measure both beam quality and wavefront aberration.
Basic idea: The incident light first passes through a microlens array (tens to hundreds of small lenses), each focusing its own region of light into a small spot on a CCD. If the incident light is a perfect plane wave, all the small spots are neatly aligned; if the wavefront is distorted, the spot positions shift. By measuring each spot’s displacement, the entire wavefront shape can be reconstructed.
Once the wavefront is obtained, the M² factor can be calculated from the “degree of phase distortion” of the wavefront — the closer the wavefront is to an ideal Gaussian distribution, the closer M² is to 1.
Limitations of computing M² from wavefront alone: It should be noted in particular that the M² factor is determined jointly by the intensity distribution and the phase distribution; M² cannot be fully calculated from wavefront information alone. The M² defined in ISO 11146 is based on the second-moment propagation characteristics and requires complete intensity-distribution information. In addition, Shack–Hartmann sensors undersample high-frequency phase errors — the microlens array has a limited number of elements and cannot resolve phase distortions far smaller than the sub-aperture scale, so the measured M² tends to be systematically low (smaller than the true value, optimistically biased). Where high-precision M² measurement is required, Hartmann-method results should be treated with caution.
Advantages:
- Single measurement gives the result, extremely fast (millisecond level)
- Wavefront aberration information obtained at the same time (Zernike coefficients, etc.)
- No mechanical motion, high reliability
Disadvantages:
- Restrictions on spot size (must cover the entire microlens array)
- The number of microlens elements determines resolution; high-frequency phase errors are undersampled
- Requires attenuation at high power
- M² measurement less accurate than scanning methods; results often systematically low
4. Phase Shifting
Phase shifting is essentially another form of interferometry, introducing a controlled phase change in the interferometer (usually by moving a mirror with a piezo ceramic), capturing several interferograms, then computing the wavefront with a phase-extraction algorithm.
This method is very accurate, but the system is complex and demanding on the environment; it is used mainly in laboratories and metrology institutes, and less often on industrial floors.
III. Key Parameters and Metrics
| Parameter | Meaning | Importance for selection |
|---|---|---|
| M² measurement range | range of M² factors measurable, usually 1.0–10 or more | ★★★★★ |
| Spot diameter measurement range | range of spot sizes measurable, e.g. 10 μm–10 mm | ★★★★★ |
| Wavelength range | compatible laser wavelength range | ★★★★★ |
| Measurement accuracy | repeatability and accuracy of M² measurement | ★★★★☆ |
| Scan travel | scanning range along the optical axis | ★★★★☆ |
| Measurement speed | time to complete one full measurement | ★★★☆☆ |
| Interface and software | data export and automation-control capability | ★★★☆☆ |
| Power handling | maximum measurable laser power | ★★★☆☆ |
Interpreting the Key Parameters
How to judge M² measurement accuracy? Generally, a good beam quality analyser achieves M² repeatability within ±2% and absolute accuracy around ±5%. Note, though, that M² results are affected by many factors — ambient vibration, air currents and whether the incidence is properly aligned all cause errors. The ISO 11146 standard states that M² measurement uncertainty is usually on the order of 10%, so do not put faith in the number of decimal places.
Why is the spot diameter range important? Because instruments based on different principles have different “comfort zones”:
- Scanning slit: can measure from a few micrometres to a few millimetres, the most adaptable
- Shearing interferometry: usually suited to spots from tens of micrometres to a few millimetres
- Hartmann method: if the spot is too small to cover the microlens array, it cannot be measured
Pitfalls of the wavelength range: A beam quality analyser’s wavelength range is limited mainly by the detector and optical components. Instruments for the ultraviolet (<400 nm) and mid-infrared (>2 μm) are much more expensive, because ordinary silicon CCDs do not respond in those bands.
Beam quality analyser software measurement interface
IV. Common Misconceptions
Misconception 1: A single spot image can yield M²
This is the most common misconception. Many people take one spot image with a beam profiler and declare “this is a Gaussian beam, M² ≈ 1.2” — completely wrong. M² describes the propagation characteristics of the beam; it can only be determined by knowing the spot size at multiple positions. A spot of the same size can have M² of 1.1 or 5, depending on the divergence angle. Remember: ISO 11146 explicitly requires measuring spot size at at least 10 positions for an M² measurement.
Misconception 2: The smaller the M², the better the beam quality
M² is indeed the gold standard for beam quality, but it is not the only standard. For example:
- Two beams may both have M² of 1.2, but one has a regular wavefront while the other has severe astigmatism — the actual focusing effect may differ a great deal
- Some applications (such as laser heating) actually want a uniform flat-top beam; M² may be large but more suitable
- M² describes only second-moment characteristics and cannot reflect high-order aberrations, side lobes, modulation and other details
So selection must consider the application scenario, not fixate on a single M² number.
Misconception 3: A beam quality analyser measures any wavelength the same way
No. A beam quality analyser’s wavelength adaptability depends on three factors: detector response, optical-component coatings and algorithm calibration. Silicon-based detectors respond only from 300–1100 nm — fine at 1064 nm, but not at 1550 nm or 2 μm, where an InGaAs detector is needed. The anti-reflection coatings on optical components are also designed by wavelength band; using the wrong band not only lowers sensitivity but may introduce extra aberrations.
Misconception 4: For measurement you just shine the light in; alignment does not matter much
Many people simply insert the beam into the instrument and start measuring, only to get readings that fluctuate wildly. In fact, the deviation of the beam’s angle of incidence has a large effect on M² results. If the beam is not parallel to the instrument’s optical axis, you are effectively measuring “a beam propagating at an angle” — the measured spot is stretched and M² comes out too large. The correct approach: first align with the aid of a wedge or CCD, ensuring the beam enters normally along the optical axis, then begin the scanning measurement.
V. Selection Advice
1. Select by Application Scenario
- Research laboratory: pursuing accuracy and comprehensiveness → recommend the scanning slit/pinhole type (ISO standard method); if wavefront measurement is also needed, add a Hartmann or shearing-interferometry scheme
- Industrial production-line QC: pursuing speed and stability → recommend the scanning slit method (ISO-compliant) or the Hartmann method (fast)
- High-power laser measurement: needs high-power tolerance → recommend the scanning slit method (only the light passing the slit reaches the detector)
- Field / on-site measurement: needs portability → recommend compact, no-moving-part shearing-interferometry or Hartmann schemes
2. Select by Key Requirements
- Must comply with ISO 11146 → choose the scanning slit/pinhole type
- Measuring ultrashort-pulse beam quality → choose a model supporting pulse mode (some CW instruments are inaccurate for pulses)
- Need UV or mid-IR measurement → confirm the detector type matches
- Need automated integration → choose a model supporting SDK and trigger control
3. Value-for-Money Advice
- Entry level (tens of thousands RMB): basic scanning-slit type, measures M² and basic parameters, suitable for teaching and small labs
- Mid level (100k–200k RMB): full-featured scanning or Hartmann type, good accuracy and speed, suitable for most R&D scenarios
- High end (300k+ RMB): multi-wavelength, high-resolution, integrated wavefront measurement, suitable for large-scale research and high-end manufacturing
VI. Application Scenarios
1. Factory QC of Lasers
Almost every commercial laser’s factory inspection report includes the M² factor. The beam quality analyser is standard QC equipment on laser production lines — every laser is checked to ensure beam quality meets spec.
2. Optical System Alignment
When building complex optical systems (such as laser processing heads, telescopes and imaging systems), a beam quality analyser can help you:
- Determine whether the laser output is normal
- Diagnose aberrations introduced by optical components
- Optimise the design of the focusing system
- Verify the system meets design targets
3. Laser Processing Process Development
The quality of laser cutting, welding and drilling is closely related to beam quality:
- The smaller the M², the smaller the focused spot and the finer the cut
- Astigmatism degrades cut-face quality
- Beam pointing stability affects processing consistency
4. Research and Metrology
- Performance evaluation in the development of new lasers
- Calibration and dissemination of laser parameter values at national metrology institutes
- Beam characterisation in academic research
5. LiDAR and Free-Space Optical Communication
These applications place extremely high demands on beam divergence and pointing stability, making the beam quality analyser an indispensable alignment and testing tool.
VII. Recommended Reading
- [M² Factor Explained: The International Standard Measure of Beam Quality](https://www.soar-laser.cn/en/m2-factor-encyclopedia/)
- [What Is Beam Quality? Why Some Lasers Can Focus to a Smaller Spot](https://www.soar-laser.cn/en/beam-quality-encyclopedia/)
- [What Is a Beam Profile? The Intensity Distribution Across a Laser’s Cross-Section](https://www.soar-laser.cn/en/beam-profile-encyclopedia/)
- [What Is a Beam Waist? Where Is a Laser’s Narrowest Point?](https://www.soar-laser.cn/en/beam-waist-encyclopedia/)
- [What Is a Wavefront? Why It Is Called the Contour Map of a Laser](https://www.soar-laser.cn/en/wavefront-encyclopedia/)
- [What Is Beam Divergence? How Far a Laser Travels Before Spreading](https://www.soar-laser.cn/en/beam-divergence-encyclopedia/)
References:
- ISO 11146-1:2021, “Lasers and laser-related equipment — Test methods for laser beam widths, divergence angles and beam propagation ratios”
- RP Photonics Encyclopedia – [Beam Quality](https://www.rp-photonics.com/beam_quality.html)
- Thorlabs – Beam Quality Analyzers Technical Documentation
- Ophir-Spiricon – M² Beam Propagation Measurement Guide
- Cinogy – CinSquare M² Tool Product Information [(Cinogy)](https://www.cinogy.com/html/cinsquare_m2_tool.html)
Leave a Reply